NNAP can help neonatal units to plan improvement
Of the 750,000 babies born each year in England, Scotland and Wales, nearly 105,000 receive specialist neonatal care. The National Neonatal Audit Programme (NNAP) supports professionals, families and commissioners in their efforts to evolve and improve the care provided to these babies.
Sam OddieConsultant Neonatologist and Clinical Lead for the National Neonatal Audit Programme
nnap@rcpch.ac.uk
In November 2020 the Royal College of Paediatrics and Child Health, published the 13th NNAP annual report.1 This describes a wide range of process and outcome measures along the neonatal care pathway, from antenatal interven-tions to clinical follow-up assessing development at two years of age.
Early breast milk feeding
For the first time, this year the audit reported on the proportion of babies born at less than 32 weeks’ gestational age who received any of their own mother’s milk on day 14 of life. For 2019 this figure is 82.4%. Interactive breast milk feeding graphs on NNAP Online can show how individual units fare in delivering breast milk to very preterm babies – allowing comparison across up to four sites (FIGURE 1).
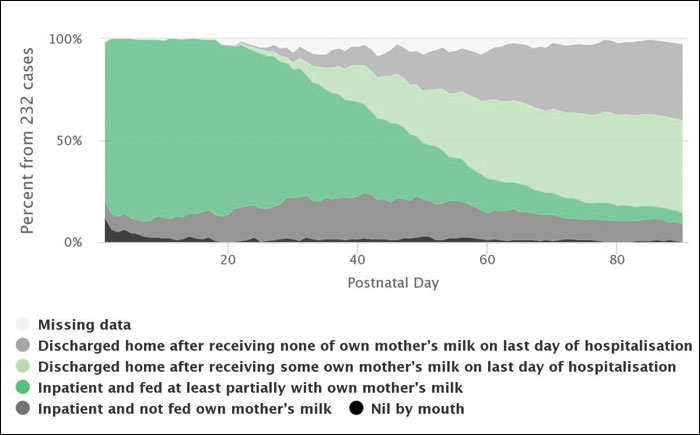
FIGURE 1 The figure illustrates mother’s own milk use for very preterm infants (gestation at birth less than 32 weeks), by the unit of care, on each day of life. Unit, and network, level figures are available on NNAP Online and enable comparisons of changes over time in usage of mother’s own milk.
Breast milk feeding at discharge home
Around six in 10 babies born at less than 32 weeks’ gestational age were discharged home from the neonatal unit receiving some of their own mother’s milk as part of their feeding (FIGURE 2). This area of support for women and their babies is vital but, unfortunately, overall there has been little improvement over time in the proportion of very preterm infants who are discharged home receiving any maternal breast milk, although there is marked geographical variation.
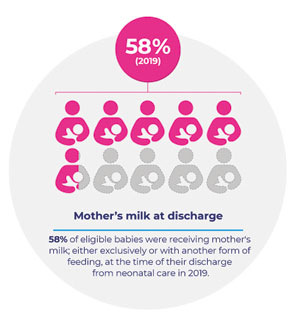
FIGURE 2 Around six in 10 very preterm babies were receiving some of their own mother’s milk at discharge home. This has not changed significantly since 2013, which is concerning given the importance of breast milk to the health of preterm babies.
Spine plots
This year NNAP has published spine plots for networks and units to review their performance in all NNAP measures in a single compact diagram (FIGURE 3). These show performance across a range of measures in comparison to both the national average and the expected range. We hope these will be useful to units in identifying areas of strength and challenge. Units can customise the presentation of spine plots to demonstrate their own performance in comparison to units of their choice.
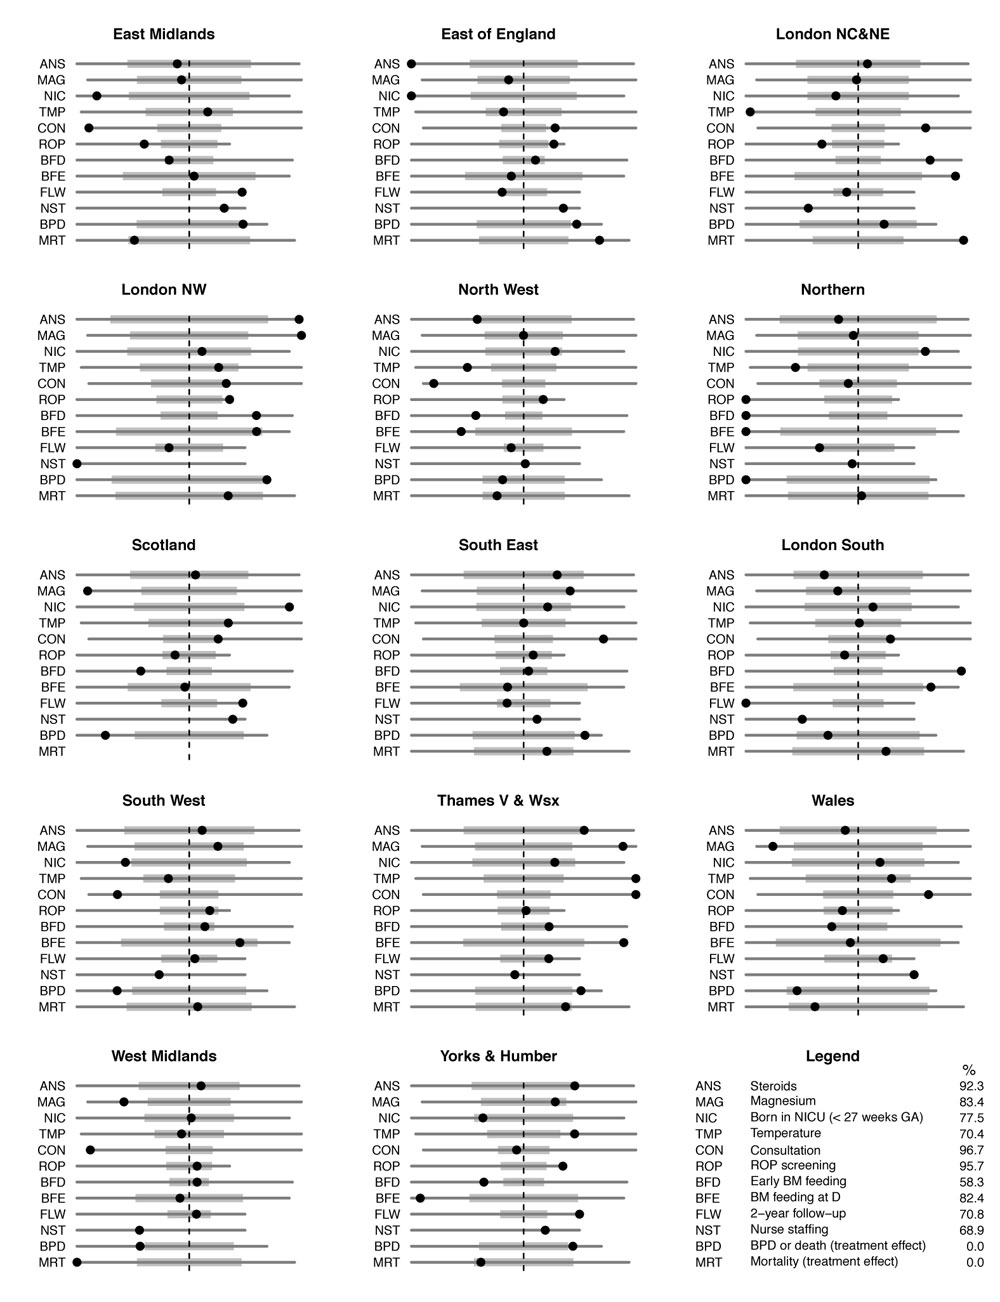
FIGURE 3 Spine plots. Performance on each measure is shown with a black disk positioned on a horizontal line for each measure. The line extends from the lowest to the highest value for that measure among all the networks. The rates are scaled so that the national rates are aligned to a single vertical line for all measures and orientated so that better performance is to the right hand side. A grey bar describes the expected range – two standard deviations either side of the national rate, akin to a funnel plot. No standard deviations are presented for the nurse staffing measure.
Other findings of the NNAP report
Perinatal teams, comprising obstetric, midwifery and neonatal staff, should be very proud of how quickly the administration of magnesium sulphate has increased over the last four years (2016=53%; 2017=64%; 2018=72%; 2019=82%). In the same period, the proportion of very preterm babies that had a normal first temperature within an hour of admission increased from 60.8% in 2016 to 70.3% in 2019, demonstrating the ability of perinatal teams to alter their care in light of published quality improvement objectives. However, unwarranted variation in these and other measures of care persists among neonatal units and networks, which identifies further opportunities for improvement of care. Nurse staffing, in particular, remains well below nationally agreed desired levels.
Outcomes, such as bronchopulmonary dysplasia, necrotising entercolitis (NEC) and late onset neonatal infection, vary strikingly between neonatal units and networks in a way that is unlikely to be explained by patient characteristics. More worryingly still, rates of mortality in very preterm babies (less than 32 weeks’ gestational age) vary widely among the 14 networks, from 4.5% to 9.0%. Known differences in case mix do not explain differences in mortality.
Driving change
Measuring and monitoring data is important, but we need to ensure that these results drive change at a local and network level to reduce the variation that we continue to see. The NNAP strives to support improvement in several ways; through our regular feedback of data to neonatal units in the form of ‘quarterly reports’, though our interactive reporting tool ‘NNAP Online’, through disseminating unit summary reports designed for public-facing display (FIGURE 4), through sharing best practice between units and networks, and through specific, targeted and evidence-based recommendations.
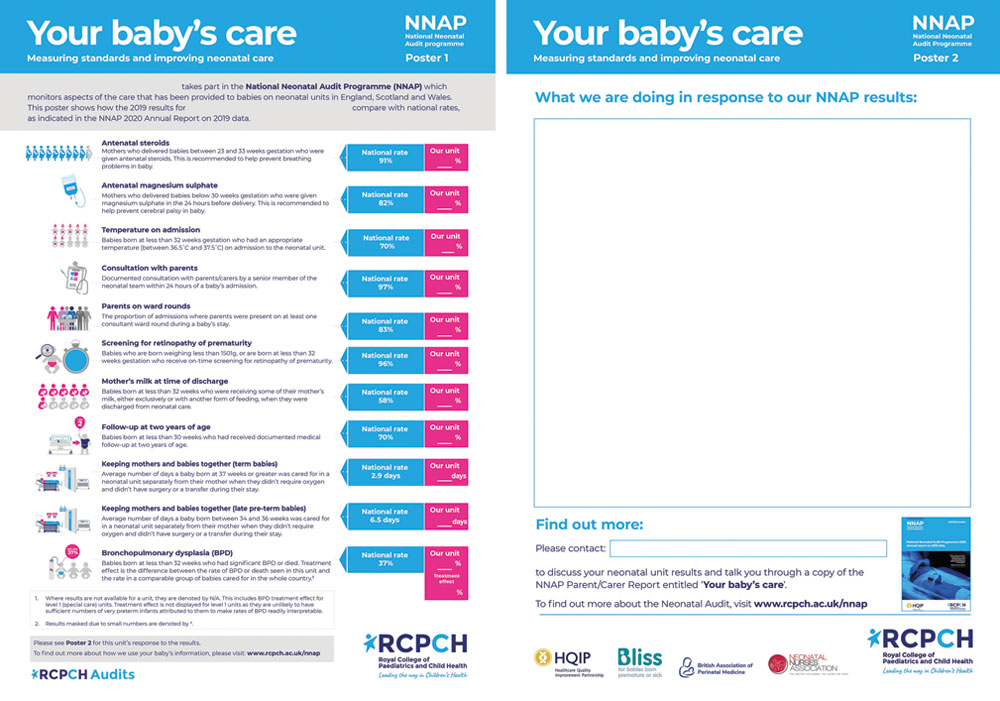
FIGURE 4 Displaying unit summary reports helps to communicate audit results to families and the wider team.
As we write the report each year we assemble a multidisciplinary, multiagency group to translate data into key findings and then further into recommendations that can be acted upon to improve neonatal care. These recommendations are honed to support the existing goals and priorities of neonatal and perinatal services, and identify new targets for improvement. They are grouped by area of care and by the audience with the ability to action the recommendation. We think you will find these helpful in planning quality improvement activities in your unit – do check them out.
As we move into the 14th year of NNAP reporting, the audit continues to develop in line with the priorities of the neonatal care community and the families that they support. For our 2020 data year, we will be reporting on deferred cord clamping. Responding to requests from stakeholders, in the 2021 data year the NNAP will collect data on brain injury in very preterm infants. An expert group has carefully considered definitions for the various outcomes; these are published in our measures guide (www.rcpch.ac.uk/sites/default/files/2021-01/nnap_2021_audit_measures_guide_v1.0 _23122020-compressed.pdf) and are also visible in the Badger system. As with infection and NEC we will be asking neonatal units to confirm they have validated their data with respect to this important complication of preterm birth.
While the NNAP report highlights key areas of progress, variation in practice and outcomes still exist between services and across the UK. Sustained efforts at a local, regional and national level to embed quality improvement methods and to target specific areas of care need to be continued to ensure the best outcomes for babies and their families across the UK. The progress made by perinatal teams, and the contribution that the PReCePT (PReventing Cerebral palsy in PreTerm labour) programme2 has made to this rapid change in practice, illustrates that we can quickly improve our care.
To read the full NNAP 2020 report on 2019 data, visit: www.rcpch.ac.uk/sites/default/files/2020-11/nnap_report_2020_final_pdf2.pdf
Or read this article in our
Tablet/iPad edition